The Store You Can't See
Ask anyone who runs an e-commerce store how it's doing and they'll answer without hesitating. Revenue's up. These lines are selling. That range is soft. Stock's tight on the hero products. They know their store.
What you're actually looking at
What they actually know is what their tools show them — the bestseller report, the analytics dashboard, the stock count, a well-developed gut. And each of those is a real instrument. But they share a blind spot so structural that most people never notice it's there: they describe the store as it was, in aggregate, after the fact. They are rear-view mirrors of varying quality. None of them holds the live, per-product state of demand as it's happening — which is the thing you'd actually want when deciding what to do next.
This isn't a story about your reporting being wrong. The numbers are fine. It's about how much of your store those numbers can't see — and how many decisions get made in that gap.
Start with the three instruments most stores trust most.
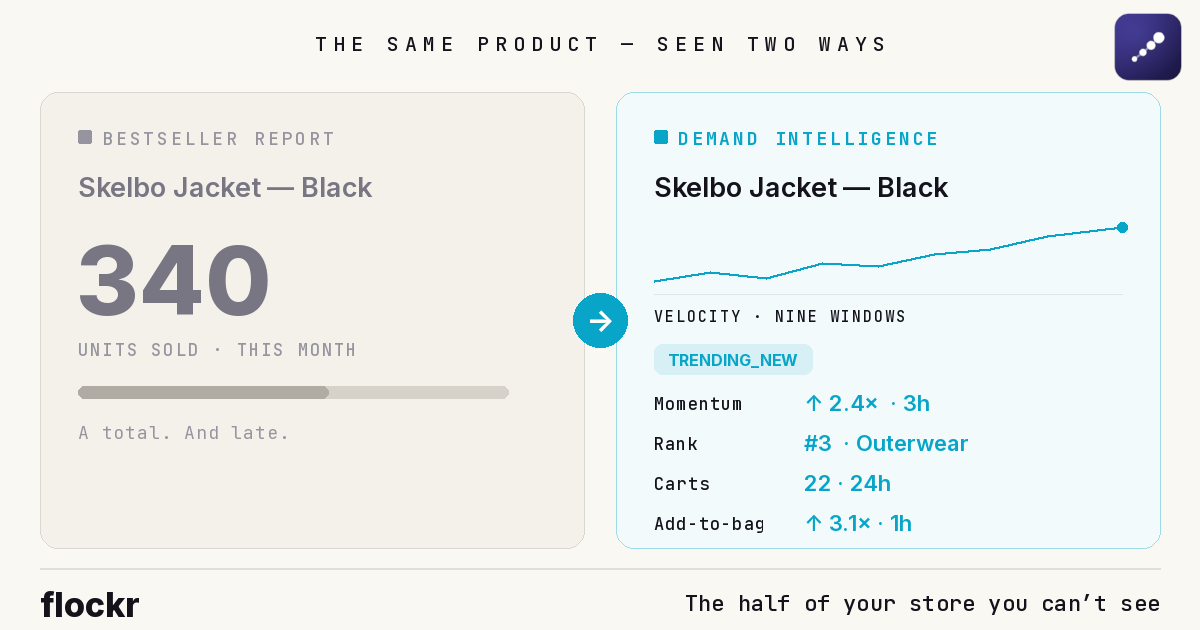
The bestseller report ranks products by what they've sold, cumulatively, usually refreshed daily or weekly. It's useful and it's honest, and it has two hard limits: it's a total, and it's late. A total can't show direction — a product that's been selling for months sits high on the list on the very day its demand falls off a cliff, because the cliff hasn't dented the cumulative figure yet. And "daily or weekly" means whatever happened this morning isn't in it.
Analytics describes sessions and outcomes — traffic, conversion, top pages, revenue — summarised across the store and read later. It's built to tell you what happened to the site. It was never built to hold what's happening to each product, right now, as a live state you could act on.
The stock system knows units on hand. It does not know units on hand relative to demand, which is the only version of that number that means anything — 400 units of something nobody wants is fine; 8 units of something selling out hourly is an emergency, and the stock system shows both as just a number.
None of these is broken. They're answering the questions they were designed for. The problem is that the question "what is the state of demand for every product in my catalogue at this moment, and what's changing" isn't one of them — and that's the question that actually governs what you should do next.
Four things your tools don't hold
Here, concretely, is what falls into the gap.
The real state of every product — not a list, but a position. Your catalogue, to most tools, is a list of items with attributes and a stock number. It isn't held as a set of states: where each product sits in its lifecycle (genuinely new and accelerating, or new and already stalling, or established and steady), whether it was just restocked, how inventory is spread across variants and which variant is the one actually running out. The same product looks identical in a product list whether it's surging or dying.
Demand as a direction, not a total. This is the big one. What moves a store is momentum — acceleration measured against a product's own recent baseline — and momentum is invisible in cumulative numbers by construction. A product going from five to fifteen views an hour is doing something important that no total will show for days. A "top seller" quietly declining looks healthy right up until the report finally catches the trend, by which point you've spent weeks featuring and funding a product on its way down. Direction is the information; totals hide it.
What's actually happening on the storefront. Almost no conventional tool can tell you, per product: which surfaces it appeared on, how many clicks it got on each, whether anything was even shown to prompt that click, what other products it was competing with on the page, and whether its product-page views came from someone clicking through your store or landing straight from an external link. That last distinction matters enormously — a product getting plenty of page views but no internal clicks is a product your own store isn't surfacing, however well it's selling. This entire layer of behaviour is dark to most stacks.
How shoppers relate to each product. Not who they are — Flockr is non-PII by default and holds none of this at the individual level — but in aggregate: how often a product gets revisited before purchase, how long it sits in carts, whether the shoppers drawn to it are price-sensitive. Cohort-level patterns that tell you how a product is wanted, not just how much.
It's not negligence; it's architecture. Your analytics tool was built for retrospective reporting, your commerce platform for transacting, your stock system for inventory, your ESP and ad tools for their own jobs. Each holds its slice well. None of them was built to maintain a live, unified, per-product model of demand — because that's a different kind of system, sitting underneath all of them, doing a job none of them was designed to do. The gap isn't a failure of your tools. It's a missing layer.
What demand intelligence actually sees
That missing layer is what demand intelligence is. For every product in the catalogue, it maintains a live record — views, add-to-bags and purchases across nine rolling time windows, from the last few seconds to the last seven days, plus lifecycle state, momentum against the product's own baseline, category rank, stock and runway, and the storefront behaviour above. Recomputed continuously, as events arrive, not assembled overnight.
Put concretely: instead of "this jacket has sold 340 units," demand intelligence holds this jacket is in trending-new, its view velocity is up 2.4× on its own three-hour baseline, it's risen to #3 in outerwear this week, it has six days of stock runway against accelerating demand, its product-page views are mostly coming straight from external links rather than your own listings, and its momentum is concentrated in one variant that's about to sell out. One product. One moment. None of which any report you currently run would tell you.
That's the picture you've been making decisions without — not because anyone got anything wrong, but because the instrument that holds it didn't exist in your stack.
Seeing it is the first half
Here's the uncomfortable bit, and then the useful one. The uncomfortable bit is that the conventional view of a store is far more partial than how confidently it gets read — and the decisions made on it are correspondingly more of a guess than they feel. The useful bit is that the gap is now closable: the live, per-product picture exists, and you can see your own catalogue through it.
Which raises the obvious next question — once you can see all of this, what changes about what you do? That's a whole piece in itself, and it's the one we'll write next. For now, if you'd like to see the real picture of your own catalogue rather than read about someone else's, book a walkthrough — we'll run it live on a store like yours.