Your dashboard is a rear-view mirror
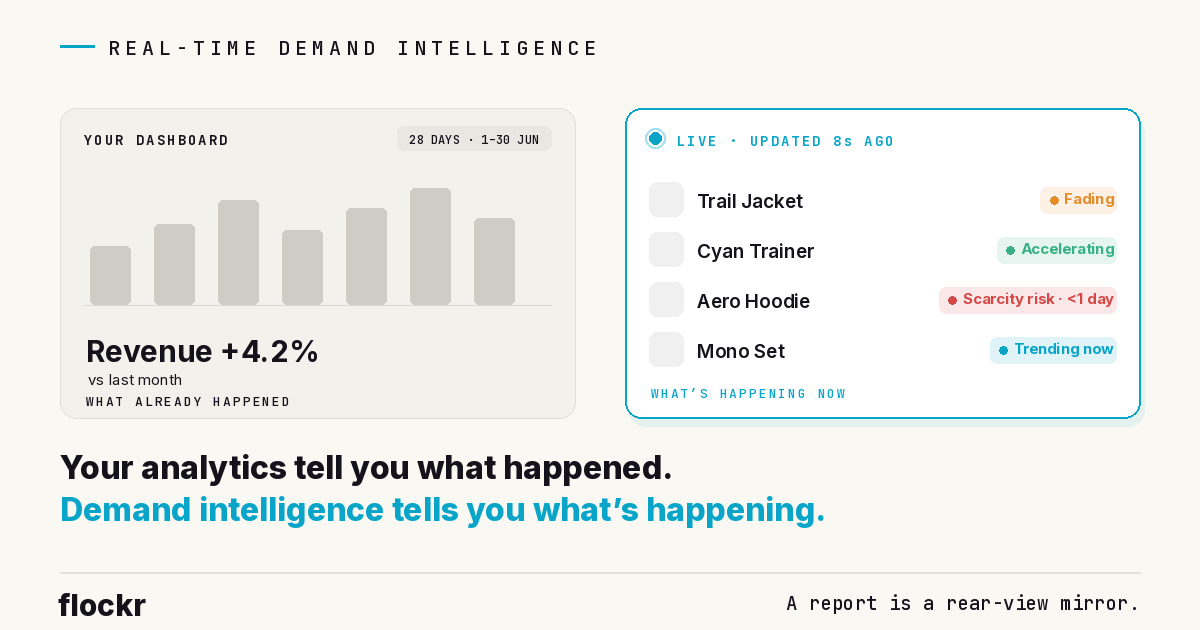
Every store has analytics, and analytics are good at exactly one thing: telling you what already happened. Demand intelligence is a different kind of system — one that tells you what's happening now, while you can still do something about it.
Open the analytics on any e-commerce store and the shape is always the same. You pick a date range — last 7 days, last month — and you read back what happened inside it. Revenue, sessions, conversion rate, top products. It's genuinely useful, and it's the right tool for a review: how did we do?
But notice what it can't do. Everything it shows you is already over. The stockout it reports is a stockout that already cost you sales. The product that surged is a product whose surge you already missed. A report is a record of the past, and the defining thing about the past is that you can't change it.
demand intelligence is built to answer a different question — not what happened? but what's happening, right now, and what's about to? That difference sounds small. It isn't. It's the difference between reading the mirror and seeing the road.
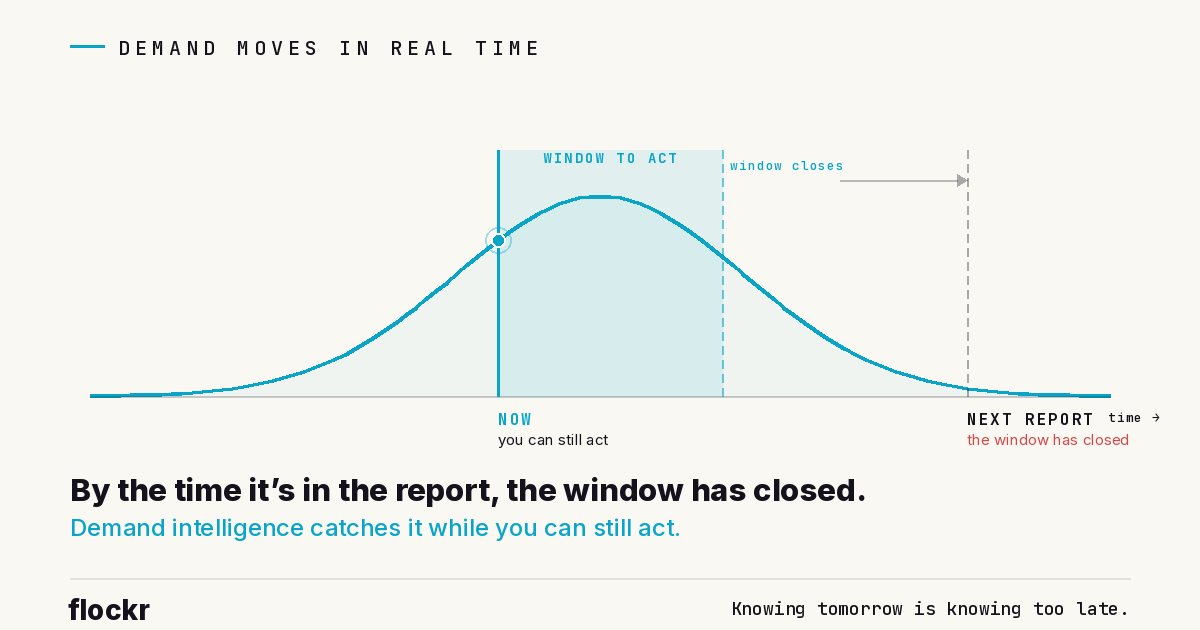
A report waits; demand moves
The reason the distinction matters comes down to one fact about demand: it doesn't hold still.
A product accelerates, crests, and fades. Stock runs down toward a stockout. A new arrival either catches on in its first week or quietly doesn't. A trend builds over three hours and is gone by the afternoon. None of these are static facts you can file and consult later — they're events, each one open for a window of time and then closed.
And that's the whole point of knowing now: the window is still open. If a product is accelerating into a stockout with a day of stock left, knowing today means you can restock and keep selling; knowing it next month means you read about the sales you lost. If demand on a product is fading but the audience is still warm, knowing today means you can re-reach them before the warmth decays; knowing later means the moment has passed. The value isn't the freshness of the number. It's that you can still act on it.
A monthly report, however accurate, can only ever describe windows that have already shut. By the time something is in the report, the time to do anything about it is gone. Knowing tomorrow is knowing too late.
An average is true, and you can't act on it
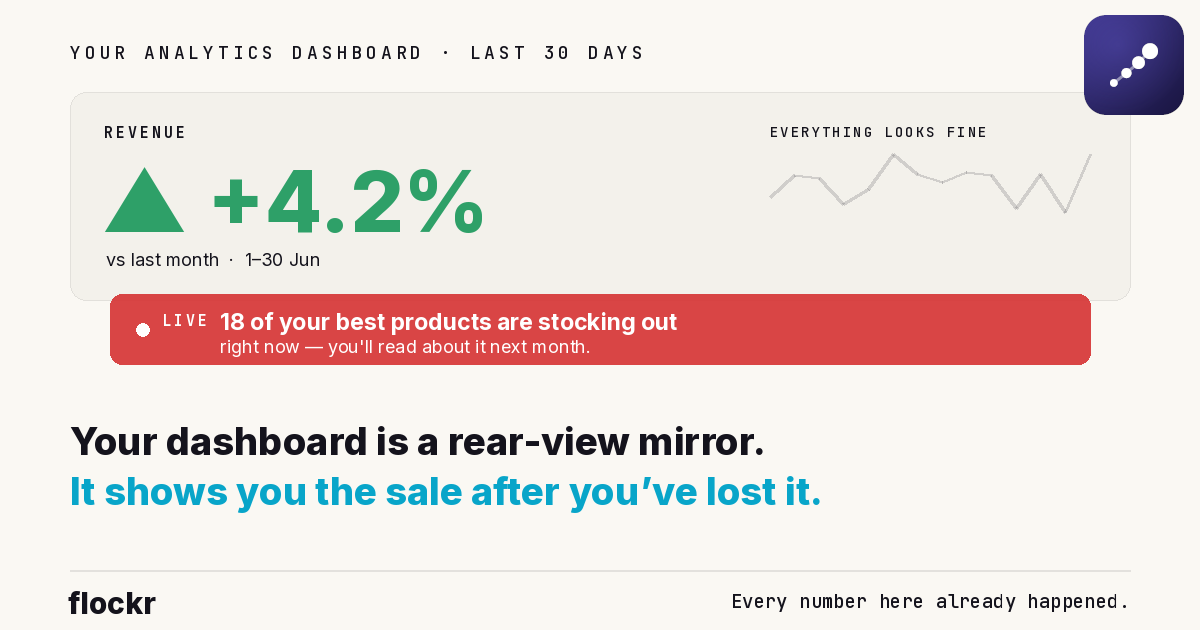
There's a second difference, and it's just as practical. Analytics aggregate — they tell you about the store. "Revenue up 4.2% this month." Perfectly true, and there is nothing you can do with it, because you don't act on a store. You act on products.
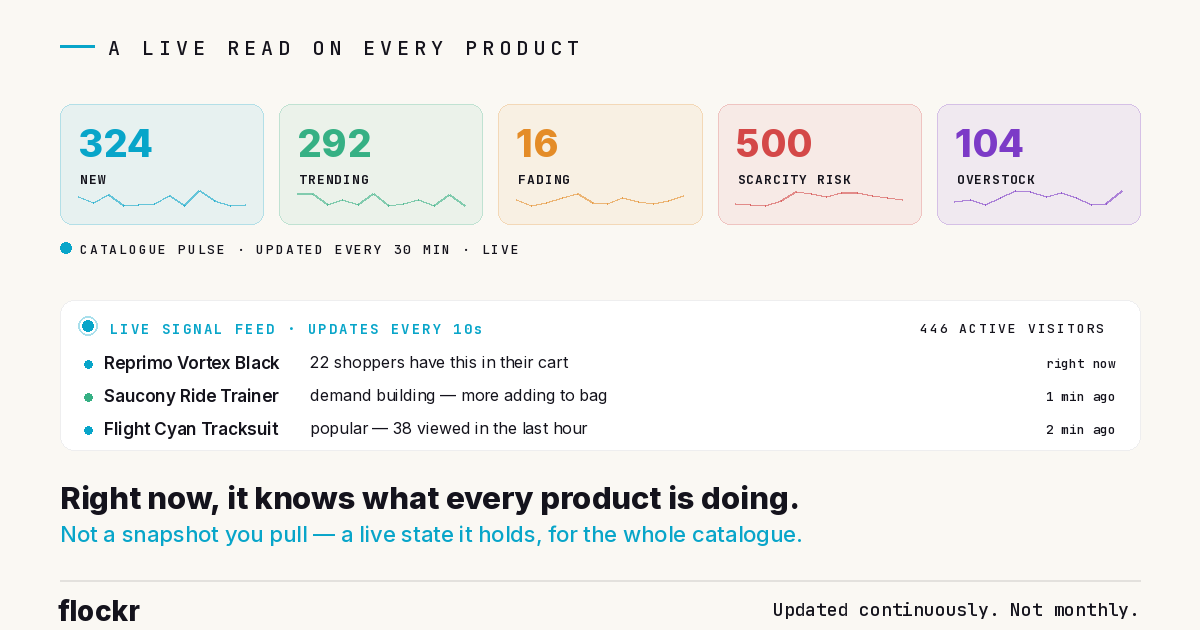
Demand intelligence holds a live state for every product in the catalogue, individually. Not "demand is up 4%," but this jacket is fading, this trainer is accelerating into a stockout, these fifty-three are genuine breakouts worth backing, these five hundred are at scarcity risk right now. The store-level number is the average of all of that — and the average hides exactly the things you'd want to act on. A catalogue can post a healthy month while eighteen of its best products are quietly running out of stock today. The dashboard shows the 4%. Demand intelligence shows the eighteen.
That's why per-product matters. Decisions happen at the level of the individual product — restock this, feature that, discount the other — so the intelligence has to live at that level too. An aggregate is a summary. A summary is not something you can act on.
You don't go and look. It tells you.
The third difference is in the direction of the information. A report is something you pull: it sits there until you remember to open it, and it shows you whatever range you ask for. If you don't look, you don't know.
A demand intelligence system runs the other way. It's computing continuously, and it surfaces a change when the change happens. A product crossing into low stock, a demand spike, a rank change, a lifecycle transition — these are detected and timestamped as events, not waiting in a report for you to find them. The live catalogue state refreshes every half hour; the moment-to-moment activity updates every few seconds. The system even keeps track of how fresh its own signals are — what share of what it's acting on is happening right now versus in the last hour versus the last week — because for a system whose whole job is timeliness, the freshness of the evidence is part of the evidence.
The effect is that you're not periodically auditing the past. You're being kept current on the present.
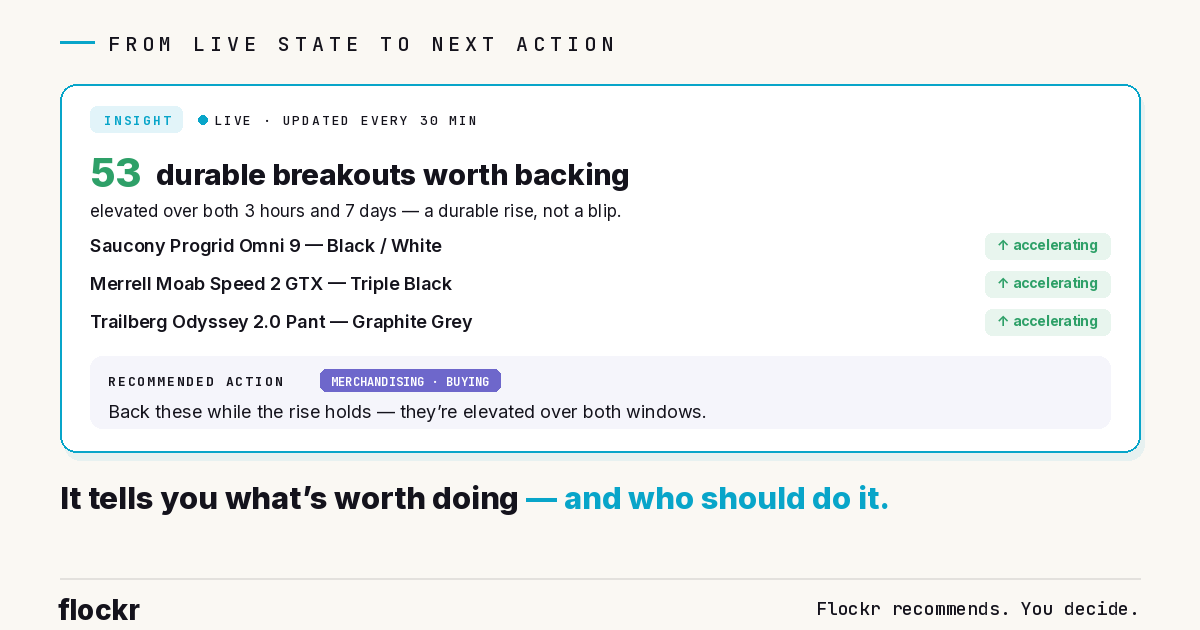
What it's actually for
None of this is in service of a nicer chart. It's in service of acting inside the window instead of reading about it afterwards: restocking before the stockout rather than after it, backing a breakout while it's still rising, re-reaching a fading product while its audience is still warm, holding back the message on a product that no longer earns it.
And because the system already holds the live state, it doesn't stop at showing it. It surfaces the handful of products genuinely worth your attention right now as insights — the ones accelerating into a stockout, the breakouts durable enough to back, the recent drops still warm enough to rescue — each with a suggested action and the team it belongs to. What you do about them is yours; the system's job is to make sure you know in time to have the choice. That's the line demand intelligence sits on: it tells you what's happening, clearly and early enough to matter, and advises on what's worth doing. The acting is yours.
Analytics answer "what happened?" — a good question, once a month, for a review. Demand intelligence answers "what's happening, and what's about to?" — the question you can still do something about. If you'd like to see the live state of your own catalogue, the demand intelligence platform page walks through it, or you can book a walkthrough on a real store.