How to increase your e-commerce conversion rate (and prove the lift is real)
Search for ways to increase your e-commerce conversion rate and you'll drown in advice: speed up the page, simplify checkout, add reviews, add urgency, add a chatbot, run a sale. Most of it is true some of the time. None of it is the actual problem.
What's a good e-commerce conversion rate?
The actual problem is attribution. A store makes a change, conversion ticks up, and everyone moves on — without knowing whether the change caused the lift, or whether traffic mix shifted, a sale ran, a competitor went out of stock, or the season simply turned. An uplift you can't attribute is indistinguishable from luck. And a conversion programme built on unattributed lifts is a programme spending real money on guesses.
So this guide has two halves. First, the levers that genuinely move conversion — honestly, without the listicle padding. Second, and more important, how to know a lever worked, because that's the discipline almost everyone skips and the one that actually compounds.
The most-asked question, and nearly the least useful. Published benchmarks put average e-commerce conversion somewhere around 2–3%, but the spread underneath that average is enormous: a high-consideration furniture store converting at 0.8% can be outperforming a repeat-purchase consumables brand converting at 5%, because price point, traffic source, category, and buying cycle move the number far more than site quality does. A "good" rate for someone else's store tells you almost nothing about yours.
The only benchmark that means anything is your own conversion rate over time, measured the same way each period. Which is the first hint at the theme of this whole piece: conversion is a measurement problem before it's an optimisation problem. You cannot improve what you cannot reliably compare against itself.
The levers that actually move conversion
Set against the noise, the things that durably lift e-commerce conversion fall into three groups.
Remove friction. Every unnecessary step, slow load, surprise cost, or moment of confusion sheds a fraction of buyers. Page speed, a short and honest checkout, mobile that genuinely works, clear delivery and returns information up front — this is unglamorous and it is where most real gains hide. Friction is the tax shoppers pay to buy from you, and lowering it lifts the whole funnel.
Build standing trust. A shopper who doesn't trust the store doesn't buy from it. Genuine reviews, a visible returns policy, security and payment signals, clear contact routes — these establish that the store is safe to transact with. This is the slow, accumulated reputation a brand earns over time.
Reduce uncertainty at the moment of choice. This is the most under-played lever, and the one closest to what we work on. Even a shopper with no friction and full trust still has to decide this product, now — and at that moment, evidence of what other shoppers are doing reduces the risk of the call. Real-time, product-specific demand signals — genuine popularity, real scarcity, true momentum — give the shopper independent evidence exactly where the decision is made. Not fabricated urgency; real social proof, computed from live behaviour, which is its own discipline. It's a high-leverage lever precisely because it acts at the point of decision rather than around it.
One honest caveat before the second half: no single tool is "conversion rate optimisation." These are levers, and a vendor that sells one of them as the whole of CRO is overselling. What ties them together — what makes any of them worth running — isn't the lever. It's whether you can prove it moved the number.
Why most conversion "uplift" numbers are wrong
Here's the uncomfortable part. The "+30% conversion!" figures that fill case studies and vendor decks are, more often than not, measurement artefacts. Four ways a real-looking number turns out to be fiction:
Before-and-after comparison. You turn a tactic on, conversion rises, you credit the tactic. But the period before and the period after differ in a dozen ways — seasonality, traffic source mix, promotions, PR, weather, what competitors did. A before/after chart can't separate your change from any of them. It's the single most common way uplift is overstated.
Sitewide, last-touch credit. A tool claims credit for every order placed by any session it touched, including the buyers who were always going to convert. This "halo" inflation makes almost anything look effective, because some share of those sales would have happened regardless.
Cherry-picked windows. Report the fortnight that looked best, omit the rest. Any sufficiently noisy metric has a good fortnight in it.
No comparison group at all. The deepest problem. Without a population that didn't get the tactic, there's nothing to compare the exposed group against, and "uplift" is just a number with no baseline.
The test for any uplift claim — yours, a vendor's, anyone's — is simple: compared to what? If the answer is "the same store last month," be sceptical. If the answer is "a group of sessions that didn't see it, with credit scoped to the actual product," you're looking at something closer to real.
How to measure conversion uplift properly
Good measurement isn't complicated, but it is disciplined. Three things make a conversion figure defensible:
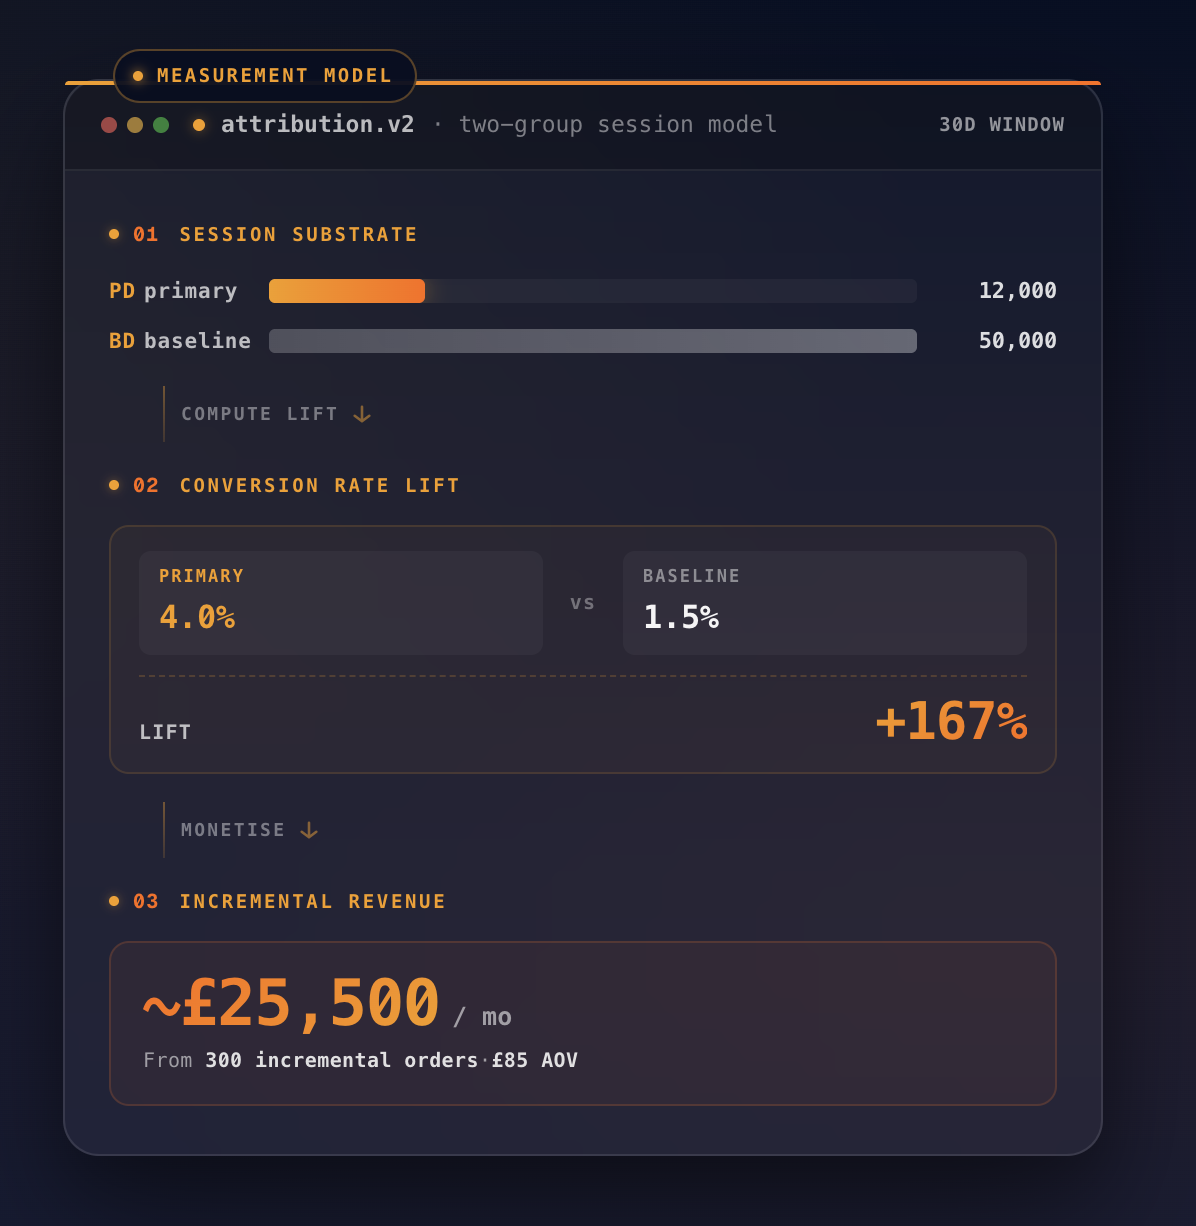
Compare exposed against not-exposed. Split sessions into those that engaged with the tactic and those that didn't, and compare order rates between the two groups rather than against the store's own past. This is how Flockr measures: a two-group, session-level model, where the primary group is sessions that clicked a product while a Flockr message was visible on a browse surface, and the baseline is every other session in the period.
Scope the credit to the product. A purchase should only count as influenced if the product bought is the product the shopper engaged with — not any purchase the session happened to make afterwards. Flockr applies exactly this constraint: click product A on a Flockr-visible listing, then buy product B, and that order is not attributed. It's what stops the model claiming halo it didn't earn.
Be honest about what the number is. This is the part nobody else says out loud. Sessions that engage with a tactic are, by definition, higher-intent than sessions that don't — they were more likely to convert anyway. So even a clean two-group comparison reports an upper bound on the true causal effect, not the effect itself. The only way to isolate pure causation is a randomised experiment. A measurement that admits this is more trustworthy than one that claims a precise causal number it cannot support. We describe the full method, and its limits, on the conversion and attribution page — the principle there is "defensible by construction, honest about its limits."
That honesty is not a weakness in the method. It's the thing that makes the numbers usable, because a figure you understand the limits of is one you can actually plan against.
What measured uplift looks like
Held to that standard, the lifts are real and commercially meaningful. Reported client outcomes include EBIKESHOP.CO.UK at +13% conversion rate and +21% revenue, Topps Tiles at +10% conversion and +7.45% revenue, and Barry M at +8% on both. These aren't before/after readings; they come from comparing exposed and non-exposed sessions with credit scoped to the product.
There's a further commercial expression of the same confidence, and it's unusual enough to state plainly. Flockr operates a contractual minimum 8× return on its licence fee, measured continuously against the customer's own two-group session-level attribution data. If the ratio dips below 8×, the commercial arrangement adjusts. It's active from day one of live mode and sized during a 14-day onboarding against the customer's real catalogue. It isn't a money-back guarantee or a marketing promise — it's a structural commercial term, and the reason it can exist at all is that the measurement underneath it is built to be defensible rather than flattering.
The real lever
The tactics matter, but they're not the hard part. The hard part — the thing that turns a conversion programme from a series of hopeful changes into something that compounds — is the discipline of measuring honestly: comparing against a group that didn't get the change, scoping credit to what actually happened, and being clear-eyed about what the resulting number can and can't tell you.
Do that, and every lever you pull either earns its place or gets cut, on evidence. Skip it, and you're optimising in the dark and calling the occasional good month a strategy. If you want to see what defensible conversion measurement looks like on a real catalogue, book a walkthrough or read how the attribution model works.
If you want to see what it looks like on a real catalogue, book a walkthrough.