
No model wrote this
Every section of the Flockr portal can now tell you what is notable in it right now, and what to do about it. Here is the part that matters in 2026: no language model wrote a word of it.
Here is a quiet problem with every analytics portal ever built, ours included. The portal is full of tables and charts. The data is all there. And a merchandiser looking at a hundred-row table of new arrivals is never going to spot that row 34 has an exceptional add-to-bag rate on very few views. Nobody reads a table like that. The data was always there; the finding wasn't.
So who does the noticing?
In the Flockr portal, the answer is now built in. Every major section can surface a computed finding about what is notable in it right now, paired with a recommended action that names who should act and where. The finding above the new-arrivals table is exactly the row-34 case: products converting far above their view volume, surfaced with the evidence, an exemplar, and the advice attached.
And the sentence that frames everything else in this post: no language model wrote any of it. Not the headline, not the numbers, not what counts as notable. Every finding is derived by arithmetic over live demand data, by a pure function that produces the identical card from the identical data, every time.

Computed, not generated
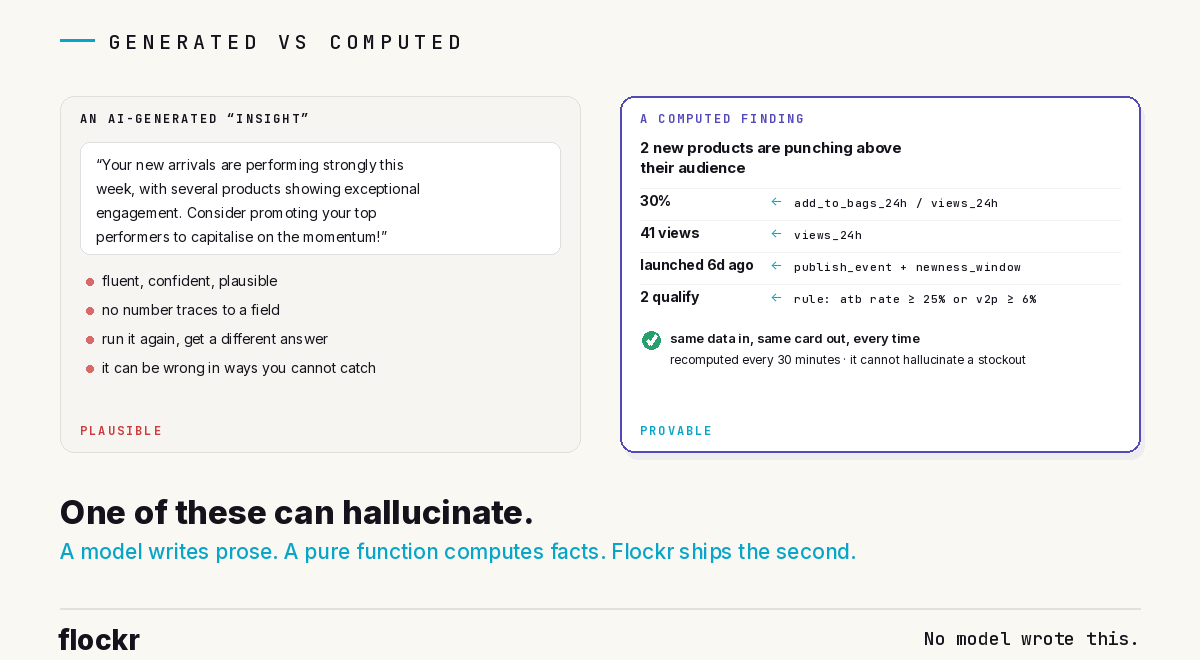
The market is currently filling up with "AI insights": a model reads your dashboard and writes you a fluent paragraph about it. The paragraphs are confident, plausible, and unverifiable. No number in them traces to a field. Run the same request twice and the answer changes. And the failure mode is invisible: a generated insight can be wrong in ways you cannot catch, because there is nothing underneath it to check.
Flockr's findings are built on the opposite principle, and it is deliberate and load-bearing. A pure function derives each finding from the data. No model writes the headline, invents a number, or decides what is notable. The same data always produces an identical card. Every figure on the card has a field behind it: the 30% is add-to-bags divided by views, the 41 is a counter, the qualification bar is a published rule. That is what makes the intelligence auditable rather than merely plausible, and it is also what makes the feature safe to put in front of a client: it cannot hallucinate a stockout.
There is one AI in this story, and it has a strictly bounded job. Signal, Flockr's assistant, can be asked about any finding, and when it is, it receives the computed numbers as ground truth and explains them. It does not re-derive the finding, produce its own version of the headline, or improve on the arithmetic. The division of labour is absolute: computation finds, Signal narrates. An assistant explaining verified numbers is useful; an assistant inventing them is a liability wearing a useful assistant's clothes.
A finding is an intersection
So what does the arithmetic actually look for? The best illustration is the scarcity finding, the first one built and the template for the rest.
It surfaces products that are simultaneously running out of stock and accelerating in demand. Notice that either condition alone is unremarkable. Low stock on a product nobody wants is just a tail product. Rising demand on a well-stocked product is just good news. The finding is the intersection: inventory about to run out on something people want more of this week than last. Runway is computed as current stock over the recent daily sell-through rate; the demand trend compares the last three days against the three before, and the rule fires on short runway crossed with acceleration.
The deliberate exclusion is as designed as the trigger. Short runway on fading demand does not fire, because that situation usually resolves itself: the demand drop will outlast the inventory drop, and advising a restock there would be advising the buyer to buy into a decline. A computed rule can explain its edges like that. It knows exactly why it does not fire, which is the same discipline the Inspector shows on the storefront side.

Two more design choices on this card say a lot about the whole feature. The stakes number is carts at risk, not the count of affected products, because if eight shoppers currently have a product in their cart and it has two days of runway, the eight carts are the concrete thing about to be disappointed. The product count is administrative; the carts are commercial.
And the mirror-image finding, overstock, contains the honesty decision we are proudest of. The natural stakes number for overstock is money: tied-up capital, markdown exposure. But there is no price field in the portal's data, so any currency figure would have been fabricated. The card shows units. Nothing on an insight card is ever inferred beyond what the data supports, even when the fabricated version would look more impressive. The overstock advice is also deliberately plural: promote, feature, mark down, or bundle, routed to merchandising, because Flockr can see that inventory is sitting, but choosing between a markdown and a homepage feature is a commercial judgement involving margin, brand and season, and Flockr has no visibility of those. It offers levers, not orders.
The same pattern runs across the Demand page. The momentum finding separates sustained climbers from short-lived spikes, two products that can sit on adjacent leaderboard rows with opposite commercial meanings, distinguishable only by reading a short window and a long window together. The fading panel carries two distinct findings, sharp recent drops and premature fades, because the advice differs: one is worth investigating as a supply or listing problem, the other is closer to a launch that did not land.
The ratio nobody's report can see
The newest panel, on new products, carries the finding this whole capability exists for.
A quiet winner is a new product converting far above its view volume: a 30% add-to-bag rate on 41 views is doing something exceptional; it just is not being seen by many people. The product is earning more demand than it is being given. And it is invisible in every conventional report: too few views to appear in a traffic report, too few absolute sales to appear on a bestseller list. Only the ratio reveals it, and only something watching behaviour per product, in real time, computes that ratio at all.
The rule is published, like everything else here: a minimum view floor first, because one add-to-bag on two views is not a 50% conversion rate, it is noise; then an add-to-bag rate of at least 25%, or a view-to-purchase rate of at least 6%. Both bars sit several multiples above typical fashion e-commerce rates, so qualifying is genuinely exceptional rather than merely good. The advice: surface them in recommendations and merchandising, because the conversion economics say they deserve more demand.
Its inverse lives on the same panel: new products pulling real views with a strict zero on conversions, a diagnostic that something on the listing is wrong, imagery, pricing, description or sizing. The bar is deliberately tight, a 50-view floor and exactly zero add-to-bags and purchases combined, because top-of-funnel browsing without conversion is completely normal, and a looser rule turns a diagnostic into noise.
One design property worth stating because it typifies the approach: those two rules are mutually exclusive by construction. One requires at least one conversion, the other requires exactly zero, so they cannot both claim the same product. That is a provable property of the arithmetic, not a deduplication patch applied afterwards.
The finding we refused to ship
Now the part of this story we suspect no competitor would publish.
A third new-products finding was specified alongside those two: the cooling launch. Products that had real early traction and have gone quiet, caught while the launch window is still open and re-featuring could still recover them. The intent is obviously right; the lifecycle post called these the most rescuable products in a catalogue.
The implementation leaned on the product's trend score as a proxy for "this had real activity". When the score's actual formula was examined, the proxy collapsed. The score is recomputed live rather than accumulated, its dominant input is the same 24-hour view window the rule was testing for collapse, and up to a third of its possible value is awarded for youth alone, regardless of any activity. Which means the rule selected products that were merely new, and would have advised re-featuring three-day-old, well-performing products as though they were dead launches. Precisely backwards.
A replacement was evaluated against live data and failed differently: lifetime counters start when Flockr begins tracking a product, product age starts at the store's publish date, and the two diverge sharply on republished products. On real data, a strongly performing three-day-old product would have been flagged as the most severely cooled item in the catalogue.
So the finding was deferred. The viable version compares a product's current demand against its own historical peak, needs a backend change, and will ship when it can be built on a number that means what it says.
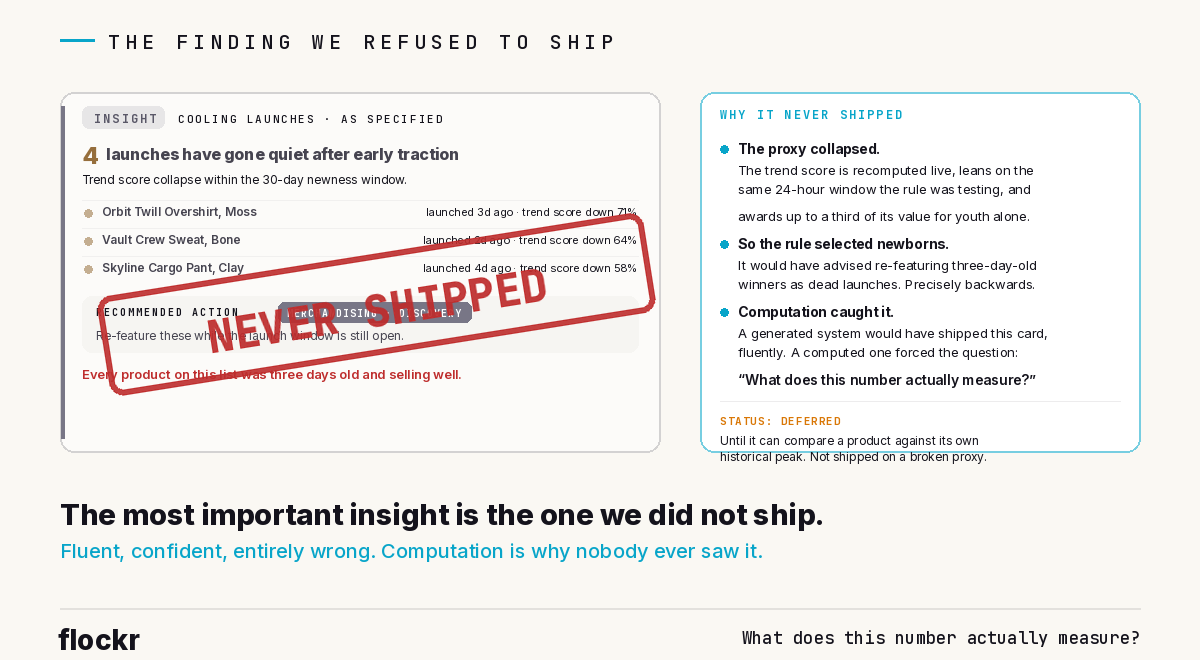
Here is why we tell that story in public. A generated-insight system would have shipped it. The card would have been fluent, confident, and entirely wrong, and nobody would have known, because there would have been no formula to examine. A computed system forced the question what does this number actually measure, and the answer changed the product. That question is the entire difference between the two approaches, and you can only ask it of arithmetic.
Capacity, honesty, limits
Three smaller disciplines complete the picture.
A section's panel shows however many findings genuinely qualify: zero, one, or several. Nothing is padded to fill space, so when a section has nothing notable, it says so plainly: no products are accelerating into a stockout right now. The empty state reads as we looked and found nothing, which is information, not absence.
Every card is honest about its own scope. A card only shows evidence its rule actually used; if a rule never read a product's trend score, no trend score appears. Exports carry a header stating the filter that produced them, and where a table on screen is truncated, the export says it contains the full qualifying set.
And one limitation, stated as plainly as we state the rest: the thresholds today are absolute. A 50-view floor that is trivial for a high-traffic retailer is unreachable for a small one, so as more clients onboard, the bars will need to become per-client configuration or sit relative to each client's own demand distribution. That is an open design question, not a solved one, and pretending otherwise would sit badly in a post like this.
Advice, never action
Every recommendation on every card uses advisory verbs and names a destination: a team, a role, a downstream tool. Prioritise these for restock, Product ops and Merchandising. Surface these in recommendations, Merchandising. Flockr says what it sees and what it would do, and then it hands over the list. It never executes.
The hand-off is literal. Export the list downloads a CSV of exactly the products in the finding, for actioning in your own systems. Ask Signal opens the assistant seeded with the finding's numbers, for the follow-up questions. Spots it, recommends it, hands you the list: that sequence is the intelligence layer, not the action layer, performed in about fifteen seconds, and it is not a demo trick. It is the product's actual position, made visible.
No model wrote this. That is not a limitation. In a year of fluent, confident, unverifiable insights, it is the feature. If you would like to see what computed looks like on a live catalogue, the demand intelligence page walks through it, or book a walkthrough on a real store.